Posts tagged ‘data visualization’
Helping social studies teachers to teach data literacy with Teaspoon languages
Last year, Tammy Shreiner and I received NSF funding to develop and evaluate computational supports for helping social studies teachers to teach data literacy and computing(see post here). We’re excited about what we’re doing and what we’re learning. Here’s an update on where we’re at on the project.
Teaspoon Languages
We have a chapter in the new book by Aman Yadav and Ulf Dalvad Berthelsen Computational Thinking in Education: A Pedagogical Perspective. This is the publication where we introduce the idea of Teaspoon Languages. Teaspoon languages are a form of task-specific languages (TSP => Teaspoon — see?). Teaspoon languages:
- Support learning tasks that teachers (typically non-CS teachers) want students to achieve;
- Are programming languages, in that they specify computational processes for a computational agent to execute; and
- Are learnable in less than 10 minutes, so that they can be learned and used in a one hour lesson. If the language is never used again, it wasn’t a significant learning cost and still provided the benefit of a computational lesson.
We say that we’re adding a teaspoon of computing to other subjects. The goal is to address the goal of “CS for All” by integrating computing into other subjects, by placing the non-CS subjects first. We believe that programming can be useful in learning other subjects. Our primary goal is to meet learning objectives outside of CS using programming. Teachers (and students eventually) will be learning foundational CS content — but not necessarily the content we typically teach in CS classes. All students should learn that a program is non-WYSIWYG, that it’s a specification of a computational process that gets interpreted by a computational agent, that programming languages can be in many forms, and that all students can be successful at programming.
Our chapter, “Integrating Computing through Task-Specific Programming for Disciplinary Relevance: Considerations and Examples” (see link here) offers two use cases of how we imagine teaspoon languages to work in classrooms (history and language arts in these examples). The first use case is around DV4L, our Data Visualization for Learning tool. The second is around a chatbot language that we developed —- and have long since discarded.
We develop our teaspoon languages in a participatory design process, where teachers try our prototypes in authentic tasks as design probes, and then they tell us what we got wrong and what they really want. Our current iteration is called Charla-bots and is notable for having user-definable languages. We have a variety of Charla-bot languages now, with English, Spanish, and mixed keywords.
Our vision for teaspoon languages is a contrast with the “Hour of Code” approach. The “Hour of Code” is a one hour programming activity that many schools use in every grade, typically once a year during CS Ed Week (in early December). The great idea is to build familiarity and confidence in programming by showing students real computer science every year. The teaspoon languages approach is to imagine one or two little learning programming activity in every social studies, language arts, and mathematics class every year. Each of these languages is tiny and different. The goal is that by the time that US students take a CS class (typically, in high school or undergraduate), they will have had many programming experiences, have seen a variety of types of programming languages, and have a sense that “programming isn’t hard.”
Meeting the Needs of Social Studies Teachers
The second paper, “Using Participatory Design Research to Support the Teaching and Learning of Data Literacy in Social Studies” (see link here) was just presented in October by Tammy at CUFA, the College and University Faculty Assembly 2021 of the National Council of the Social Studies. (We have a longer form of this paper that we have just submitted to a journal.) This is an exciting paper for me because it’s exactly addressing the critical challenge in our work. We can design and implement all kinds of prototype Teaspoon languages, but to achieve our goals, teachers in disciplines other than CS have to see value and adopt them.
The paper is about our workshops with practicing social studies teachers. Tammy has a goal to teach social studies teachers how to teach data literacy. She has built a large online education resource (OER) on teaching data literacy in social studies. Learning data literacy involves being able to read, comprehend, and argue with data visualizations, but also being able to create them. That’s where we come in. Her OER links to several tools for creating data visualizations, like Timeline JS, CODAP, and GapMinder. Most of them were not created for social studies teachers or classes. When we run these workshops, our tools are just in-the-mix. We offer scaffolding for using all of them. These are our design probes. The teachers use the tools and then tell us what they really want. These are our data, and we analyze them in detail —- as in this paper.
Let’s jump to the bottom line: We’re not there yet. The teachers love the OER, but get confused about why should do in their classes. They find the tools for data visualization fascinating, but overwhelming. They like DV4L a lot:
One pre-service teacher explained that they preferred our prototype over other tools because “(with the prototype DV4L) I found myself asking questions connected to the data itself, rather than asking questions in order to figure out how to work the visual.”
Recently, I held a focus group with some social studies teachers who told me that they won’t use any computational tools —- they believe in teaching data visualization, but all created with pencil and ruler. That’s our challenge: Can we be more powerful, more enticing, and easy enough to beat out pencil and ruler? Our tool, DV4L, is purpose-built for these teachers, and they appreciate its advantages — and yet, few are adopting. That’s where we need to work next.
Opportunities for Social Studies Teachers to Get Involved
If you know a social studies teacher who would want to keep informed about our work and perhaps participate in our workshops or studies, please have them sign up on our mailing list. Thank you!
Often, what teachers tell us they really want suggests new features or entirely new tools. We have two ongoing studies where we are looking for design feedback from social studies teachers. If you know social studies teachers who would like to play with something new (and we’ll pay them for their time), would you please forward these to them?
Timeline Builder
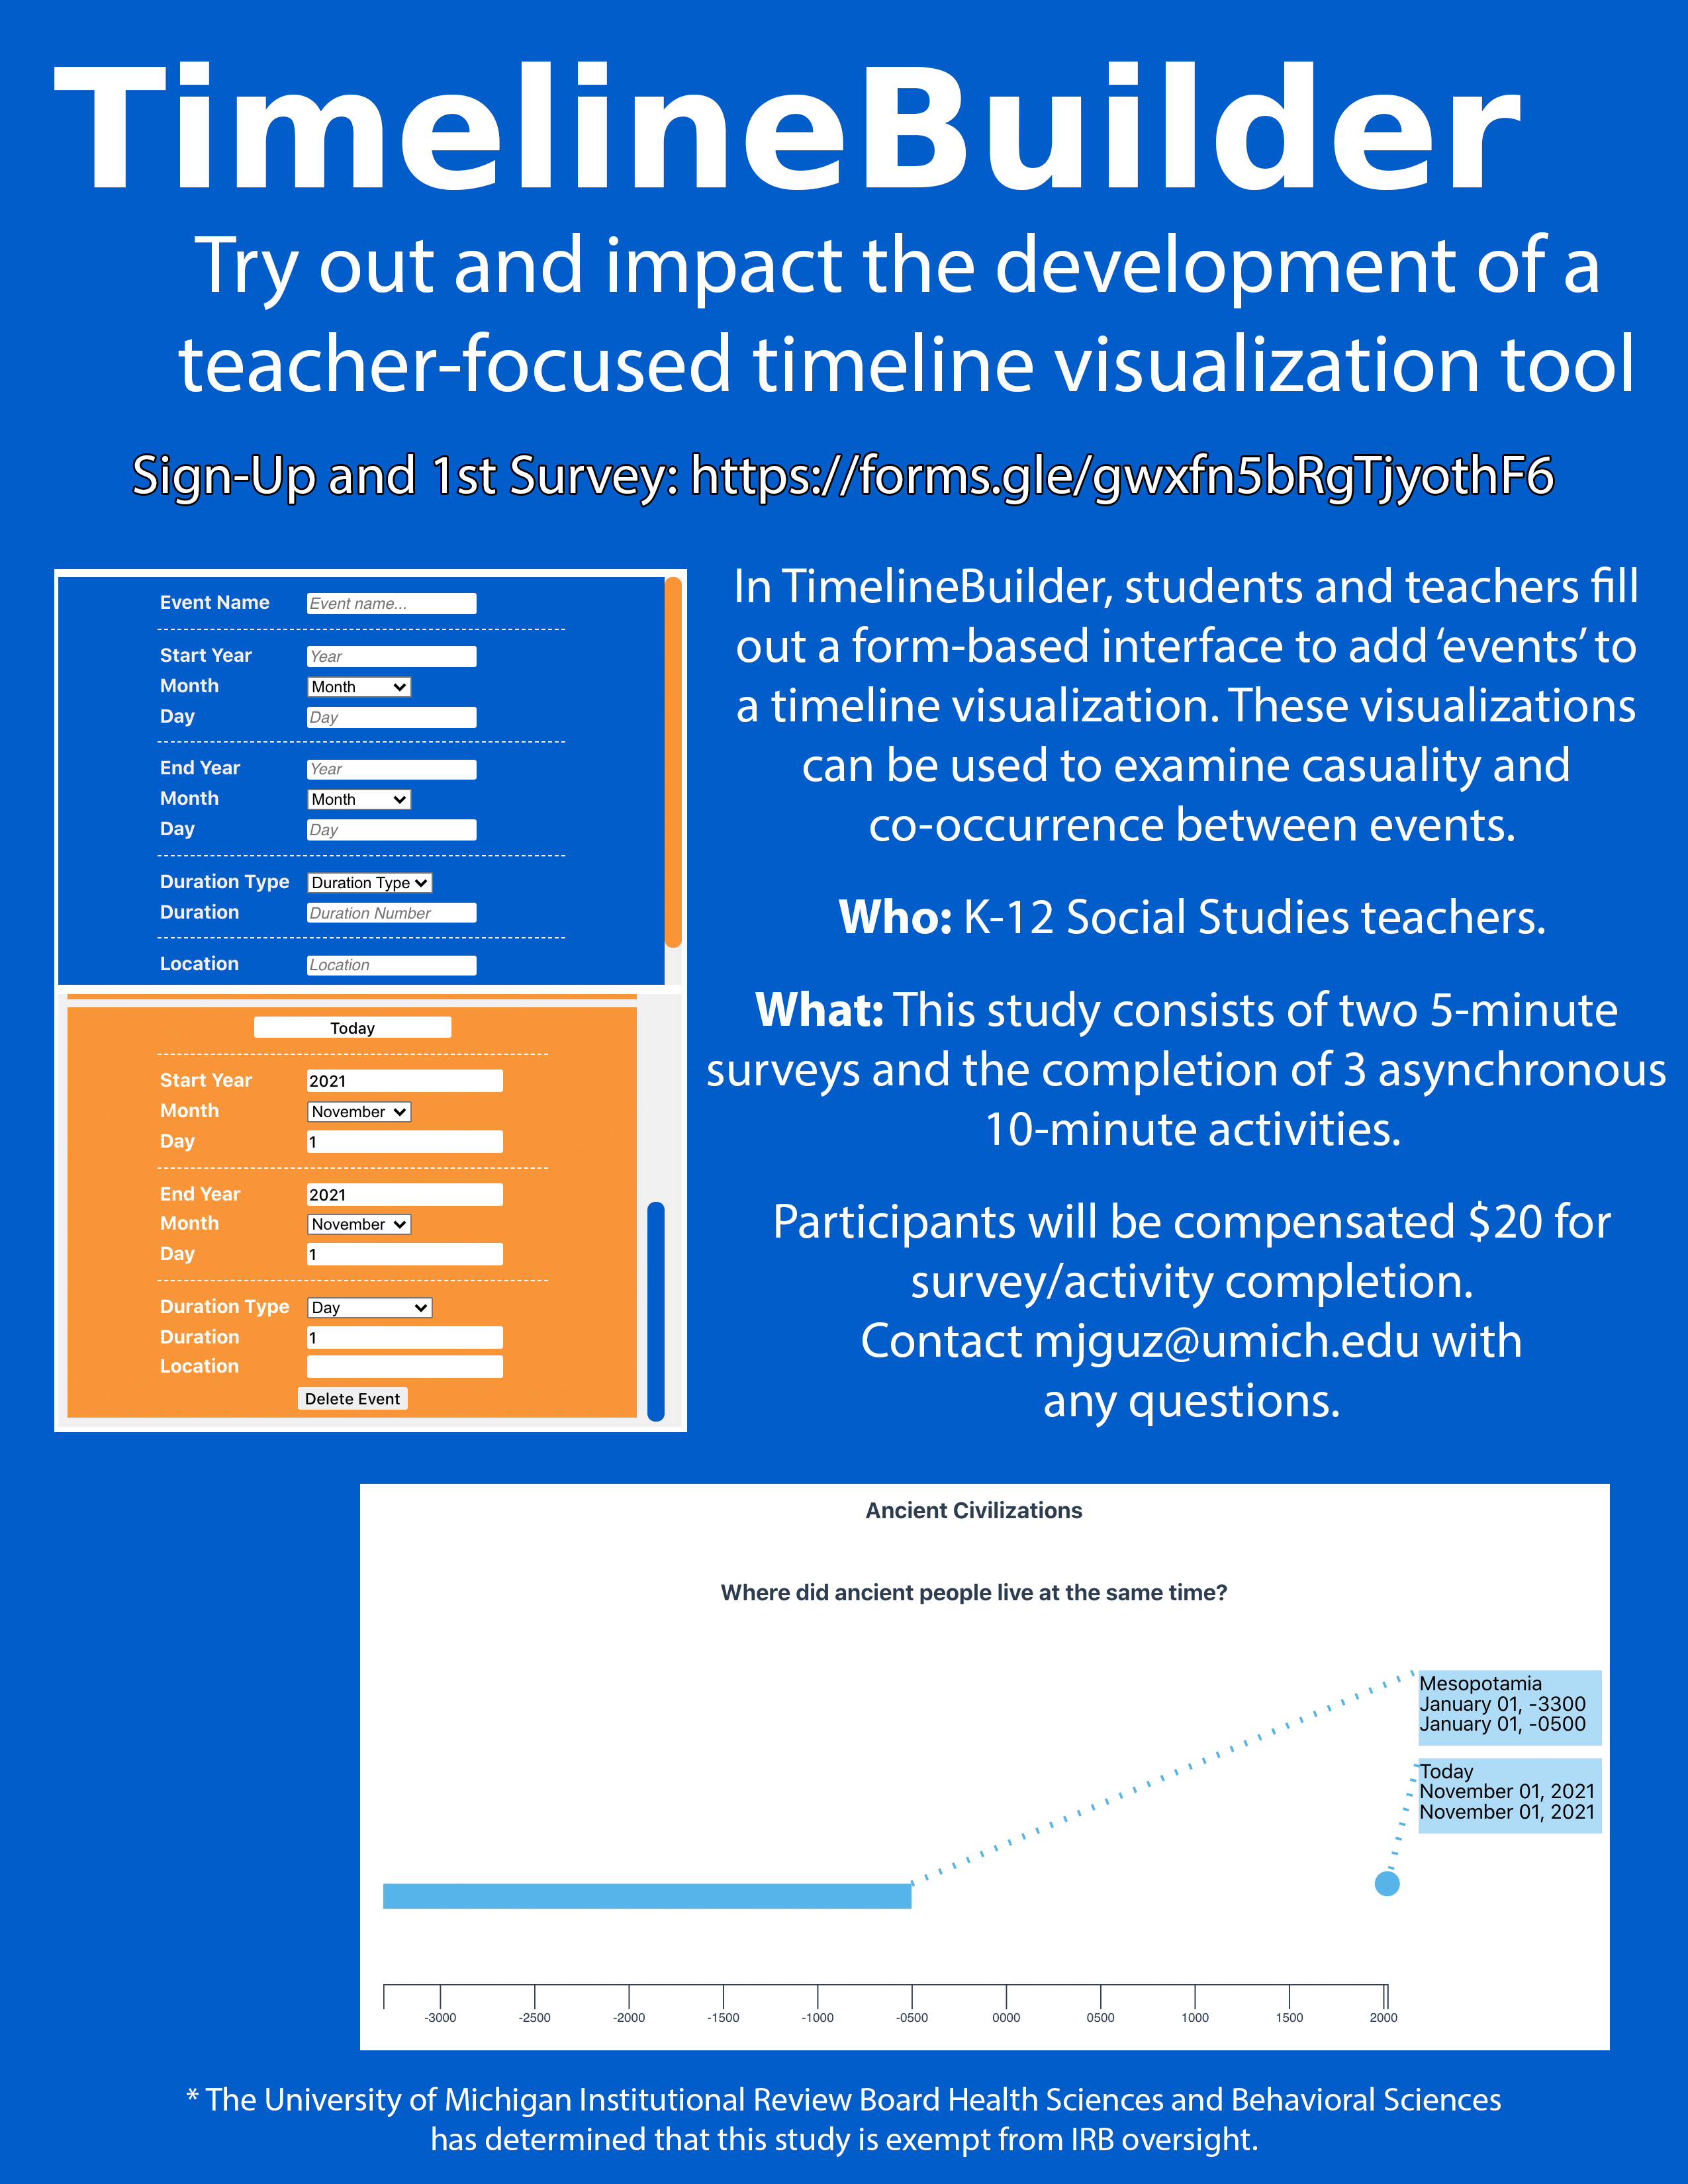
We’re looking for K-12 Social Studies teachers to try out our new timeline visualization tool, TimelineBuilder. TimelineBuilder has been made with teachers and usability in mind. In it, ‘events’ are added to a timeline using a form-based interface. Changes to the timeline can be seen automatically, with events showing up as soon as they are added.
This study will consist of completing 2 surveys and 3 asynchronous activities guided by worksheets. All participants will be compensated with a $20 gift card for survey and activity completion. There is an additional option to be invited to a focus group, which will provide additional compensation.
If you are interested in participating in this study, you can complete the consent form and 1st survey here. (Plain text Link: https://forms.gle/gwxfn5bRgTjyothF6 )
Please contact Mark Guzdial (mjguz@umich.edu) or Tamara Nelson-Fromm (tamaranf@umich.edu) with any questions.
The University of Michigan Institutional Review Board Health Sciences and Behavioral Sciences has determined that this study is exempt from IRB oversight.
DV4L Scripting Study
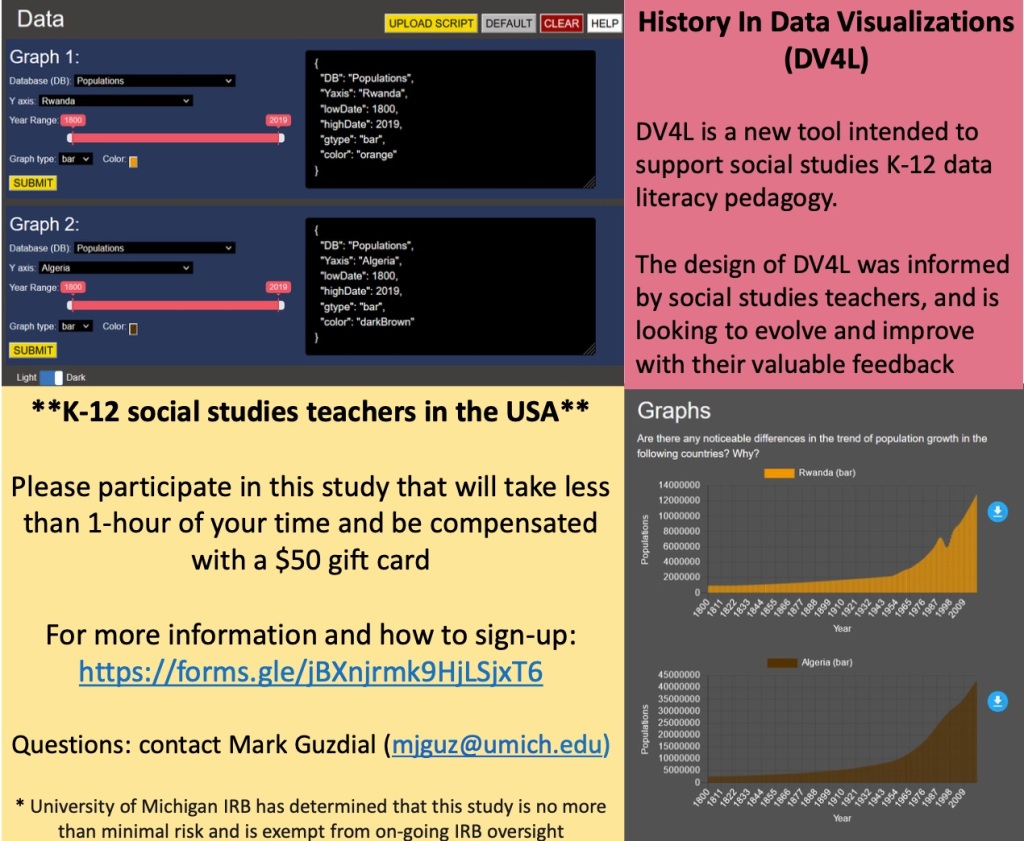
Through our work with social studies educators thus far, we have designed the tools DV4L-Basic and DV4L-Scripting specifically to support data literacy standards in social studies classrooms. If you are a social studies middle or high school teacher, we would love to hear your feedback. If you can spare less than an hour of your time to participate in our study, we will send you a $50 gift card for your time and valuable feedback.
If you are interested but want more details, please visit/complete the consent form here: https://forms.gle/yo3yWGThQ1wnhu7g7
For questions or concerns, please contact Mark Guzdial (mjguz@umich.edu) or Bahare Naimipour (baharen@umich.edu).
References
Guzdial, M. and Tamara L. Shreiner. 2021. “Integrating Computing through Task-Specific Programming for Disciplinary Relevance: Considerations and Examples.” In Computational Thinking in Education: A Pedagogical Perspective, Aman Yadav and Ulf Dalvad Berthelsen (Eds). PDF of Submitted.
Shreiner, Tamara L., Mark Guzdial, and Bahare Naimipour. 2021. “Using Participatory Design Research to Support the Teaching and Learning of Data Literacy in Social Studies.” Presented at CUFA, the College and University Faculty Assembly 2021 of the National Council of the Social Studies. PDF

Recent Comments