Posts tagged ‘participatory design’
Participatory Design to Set Standards for PCAS Courses
My main activity for the last year has been building two new courses for our new Program in Computing for the Arts and Sciences (PCAS), which I’ve blogged about recently here (with video of a talk about PCAS) and here where I described our launch. Here are the detailed pages describing the courses (e.g., including assignments and examples of students’ work):
- COMPFOR 121: Computing for Creative Expression
- COMPFOR 111: Computing’s Impact on Justice: From Text to the Web
When we got the go-ahead to start developing PCAS last year, the first question was, “Well, what should we teach?” The ACM/IEEE Computing Curriculum volumes weren’t going to be much help. They’re answering the question “What do CS, Software Engineering, Information Technology, etc. majors need to know?” They’re not answering the question, “What do students in liberal arts and sciences need to know about Computing for Discovery, for Expression, and for Justice?”
My starting place was the Computing Education Task Force (CETF) report (see link here) which summarized dozens of hours of interviews and survey results from over 100 faculty. We decided that the first two courses would be on Expression and Justice. There already were classes that introduced programming in a Discovery framing in some places on campus (and my colleague, Gus Evrard, has taken that even farther now — but that’s another blog post). There was nothing for first year students to introduce them to coding in an Expression or Justice context.
When faced with a design problem, I often think “WWBD” — “What Would Betsy Do.” I learned about participatory design working with Betsy DiSalvo at Georgia Tech, and now I reach for those methods often. I created participatory design activities so that Expression and Justice faculty in our College of Literature, Science, and the Arts (LSA) could set the standards for these courses.
I created three Padlets, shared digital whiteboards. A group of people edit a whiteboard, and everyone can see everyone else’s edits.
- One of them was filled with about 20 learning goals derived from the CETF report. These aren’t well-formed learning goals (e.g., not always framed in terms of what students should be able to do). These were what people said when we asked them “What should students in LSA learn about computing?” I wasn’t particularly thorough about this — I just grabbed a bunch that interested me when I reviewed the document and thought about what I might teach.
- I created two more Padlets with possible learning activities for students in these classes. Yvette Granata had recommended several books to me on coding in Expression and Justice contexts, so a lot of the project ideas came out of those. These were things that I was actively considering for the courses.
I ran two big sessions (with some 1:1 discussions afterwards with advisors who couldn’t make the big sessions), one for Expression and one for Justice. These were on-line (via Zoom) with me, Aadarsh Padiyath (PhD student working with me and Barbara Ericson), and a set of advisors. The advisors were faculty who self-identified as working in Computing for Expression or Computing for Justice. The design sessions had the same format.
- I gave the advisors a copy of the learning goals Padlet. (Each session started with the same starting position.) I asked them as a group to move to the right those learning goals they wanted in the class and to move to the left those learning goals that they thought were less important. They did this activity over about 20-30 minutes, talking through their rationale and negotiating placement left-to-right.
- I then gave the advisors a copy of the learning activities Padlet. Again, I asked them to sort them right is important and left is less important.. Again, about 20-30 minutes with lots of discussion.
We got transcripts from the discussion, and Aadarsh produced a terrific set of notes from each session. These were my standards for these courses. This guided me in deciding what goes in and what to de-emphasize in the courses.
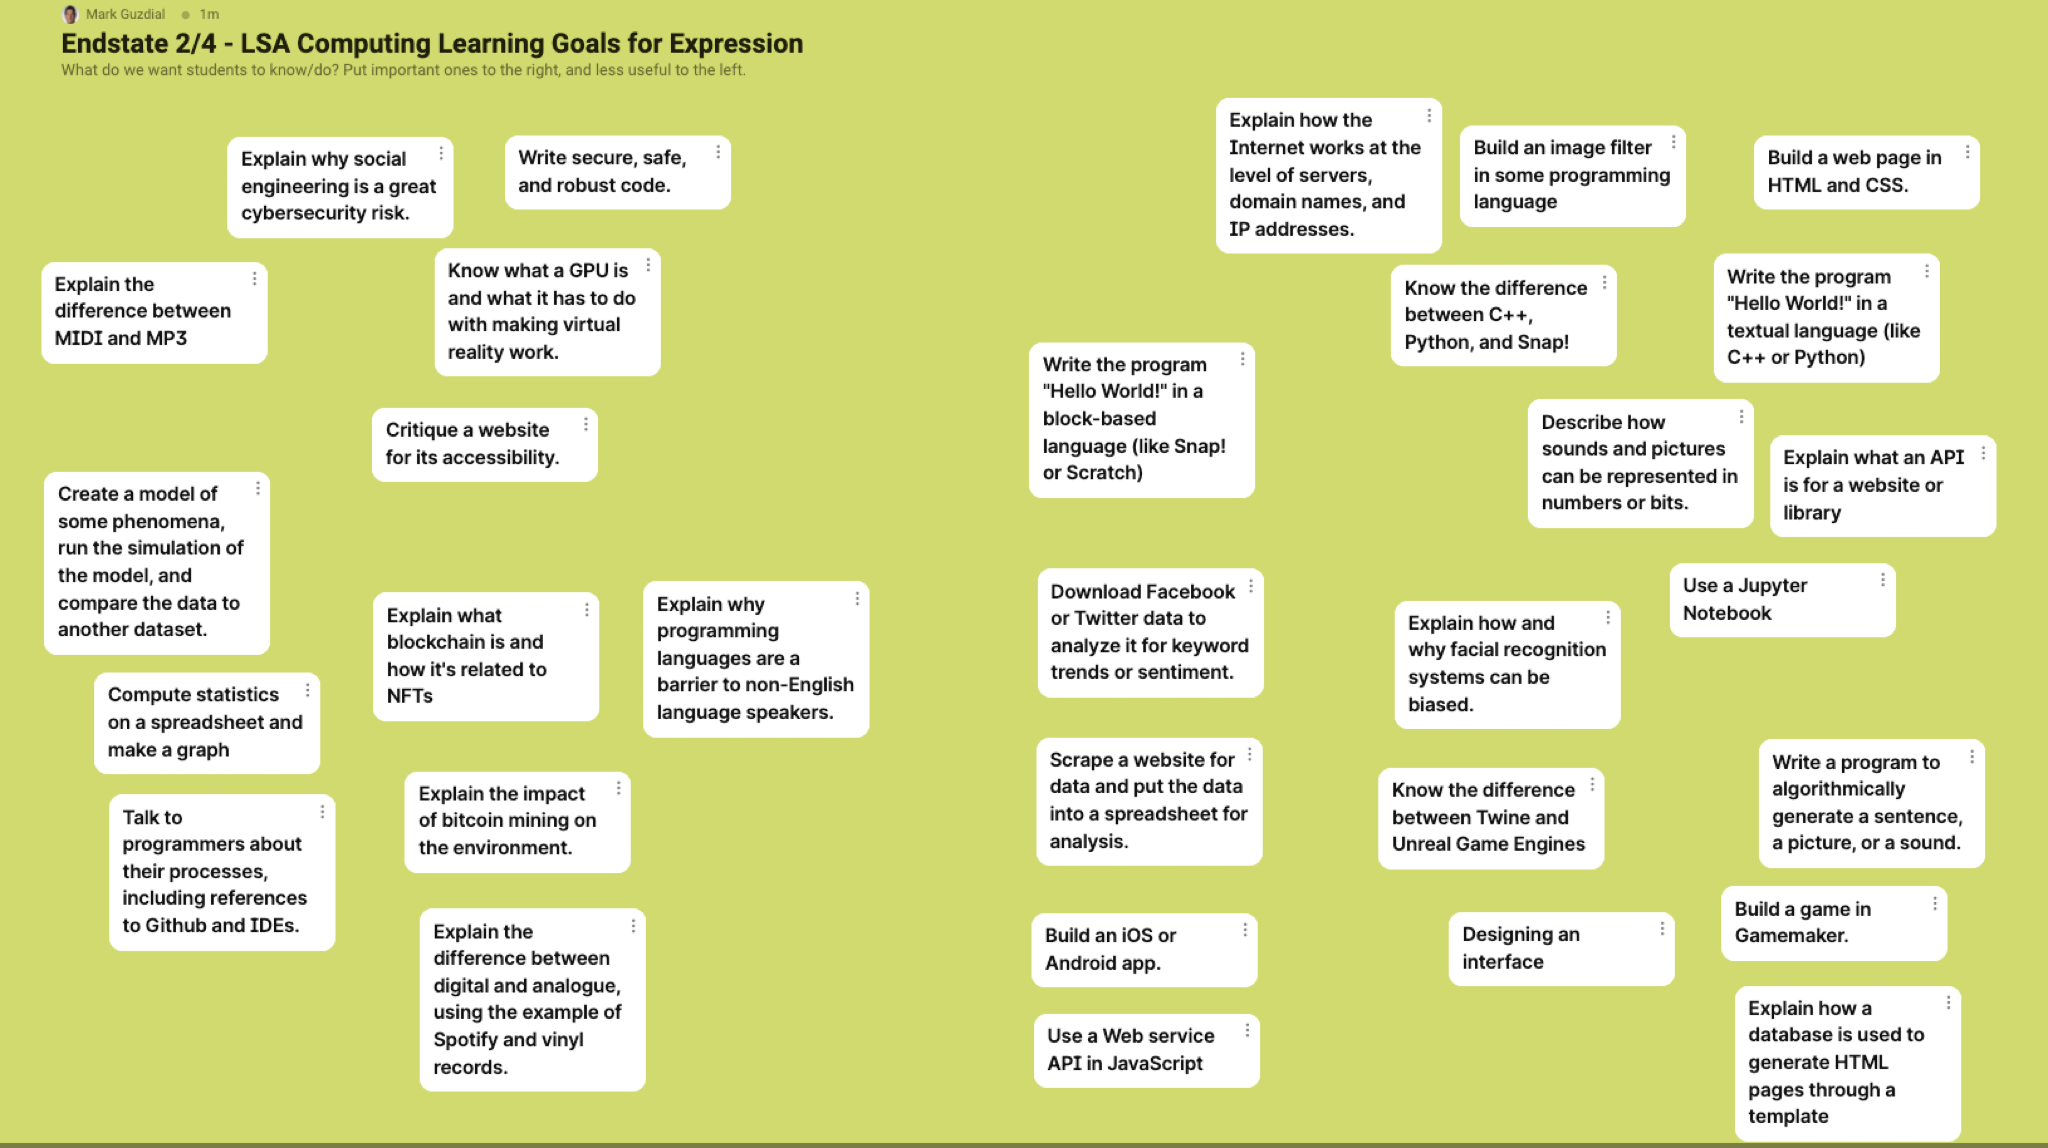
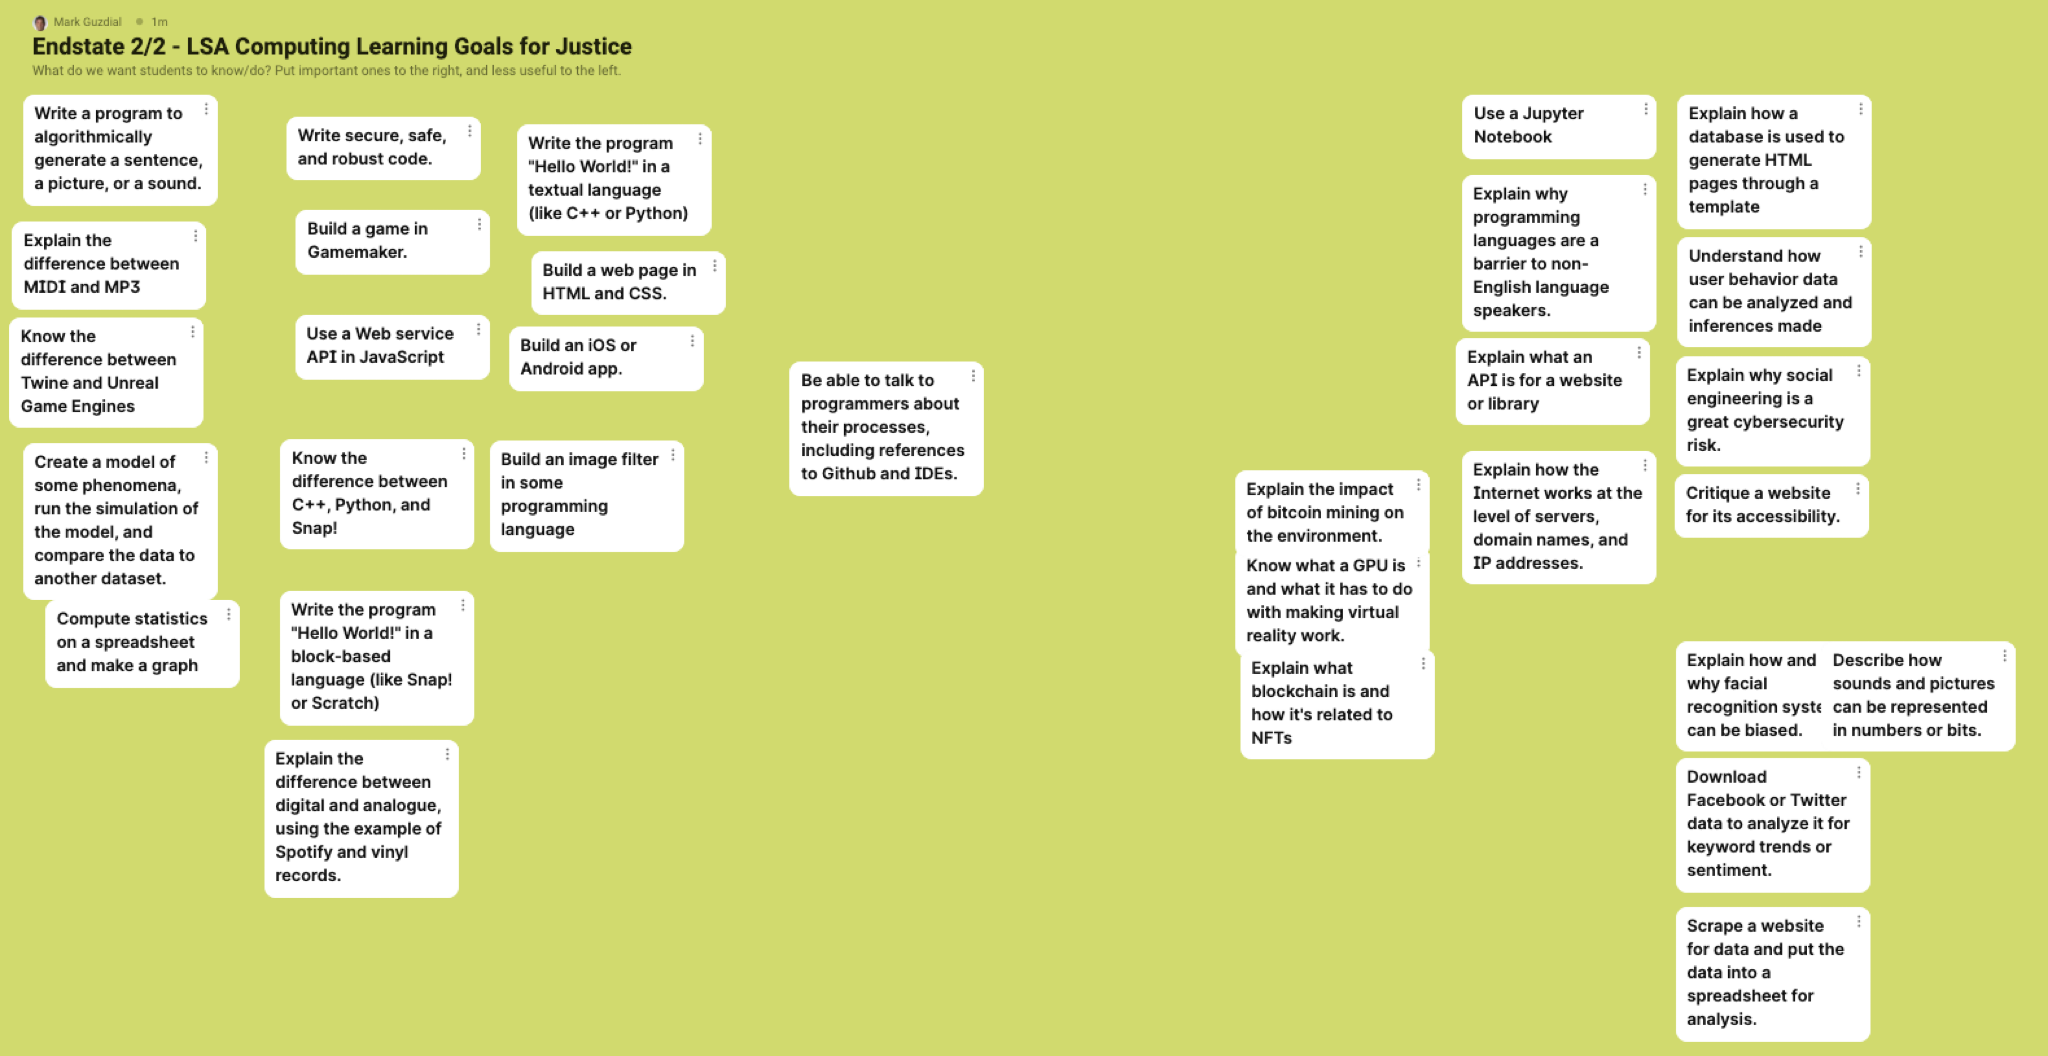
Below are the end states of the shared whiteboards. There’s a lot in here. Three things I find interesting:
- Notice where the computer science goals like “Write secure, safe, and robust code” end up.
- Notice what’s in the upper-right corner — I was surprised in both cases.
- Notice that building chatbots is right-shifted for both Expression and Justice. Today, you’d say “Well, of course! ChatGPT!” But I held these sessions in February of 2022. The classes have a lot about chatbots in them, and that put us in a good place for integrating discussions about LLMSs this last semester.
Expression Learning Goals
(To see the full-res version, right-click/control-click on the picture, and open the image a new tab.)
Justice Learning Goals
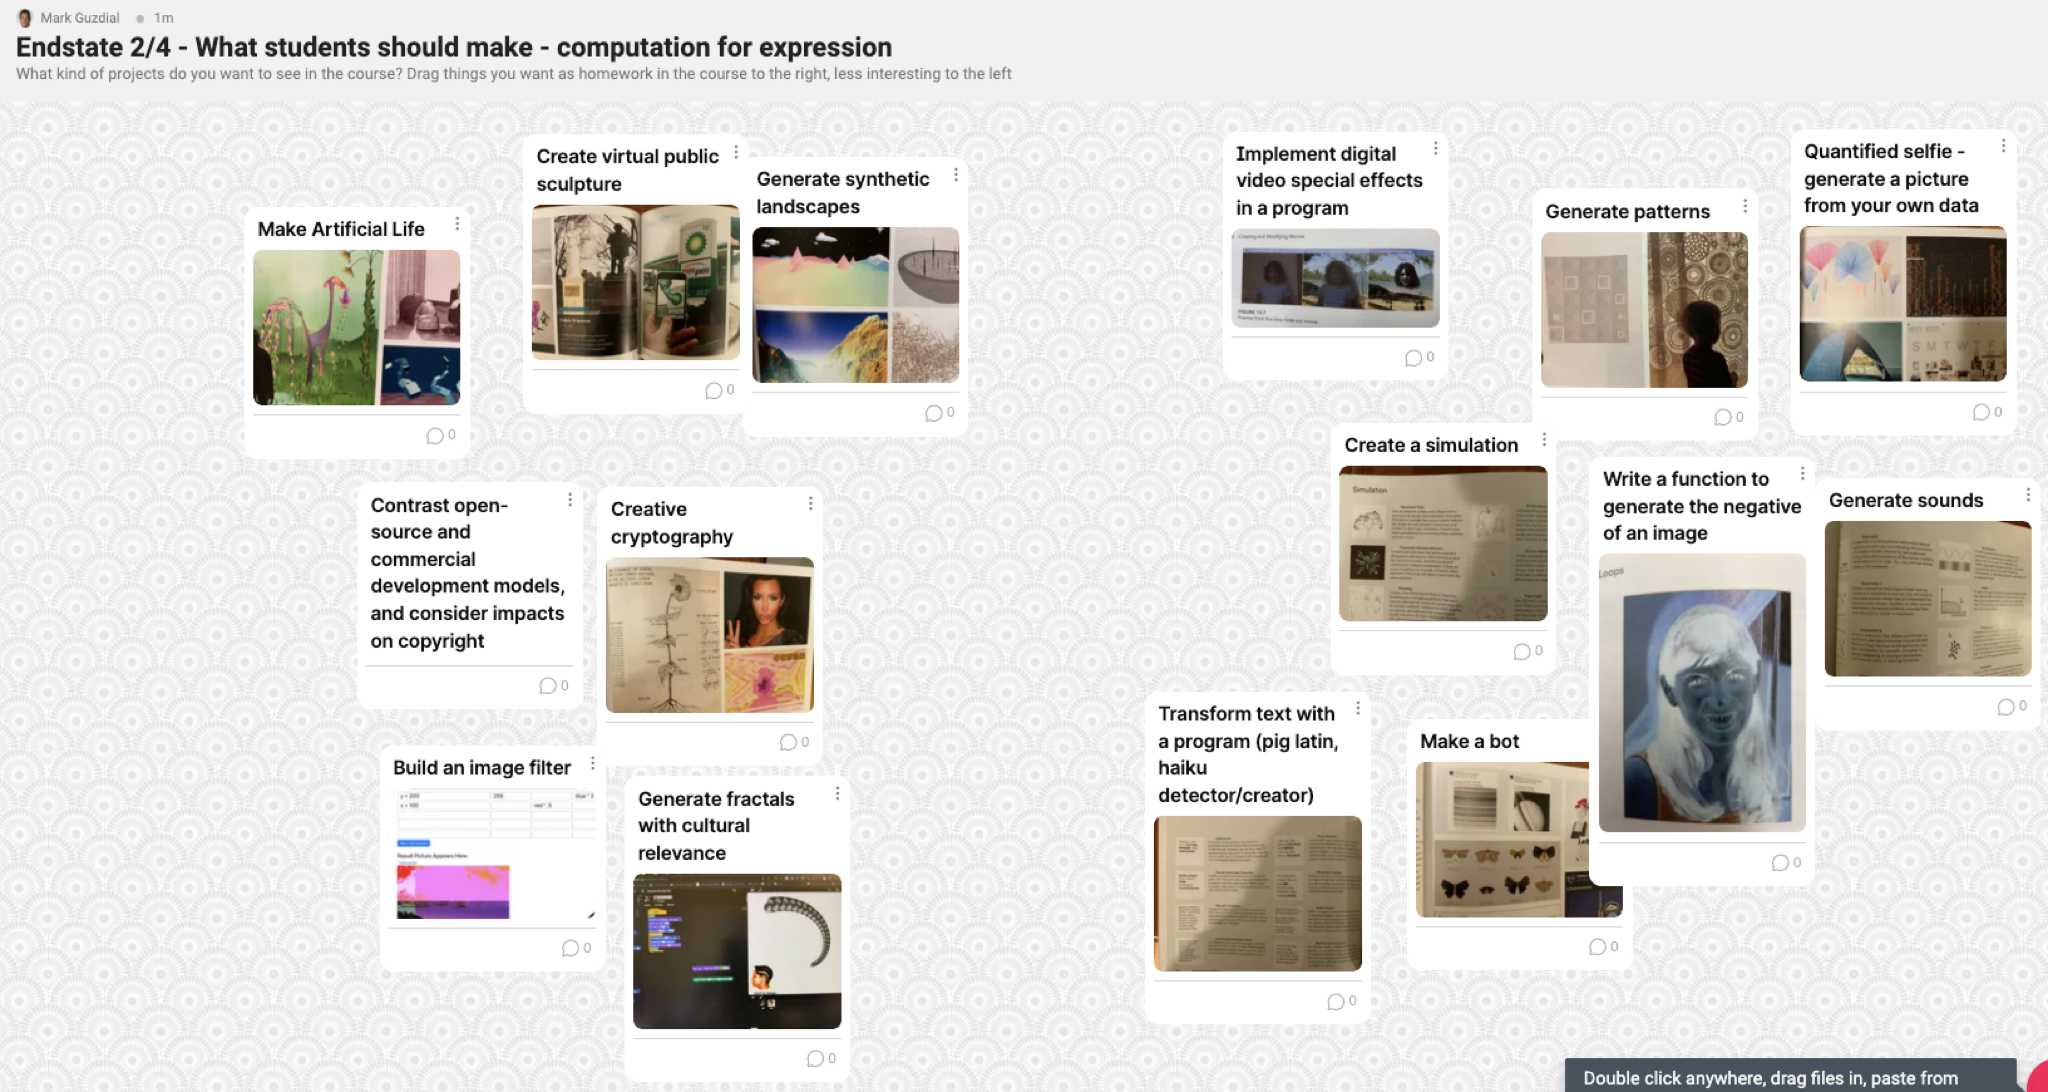
Expression – Learning Activities
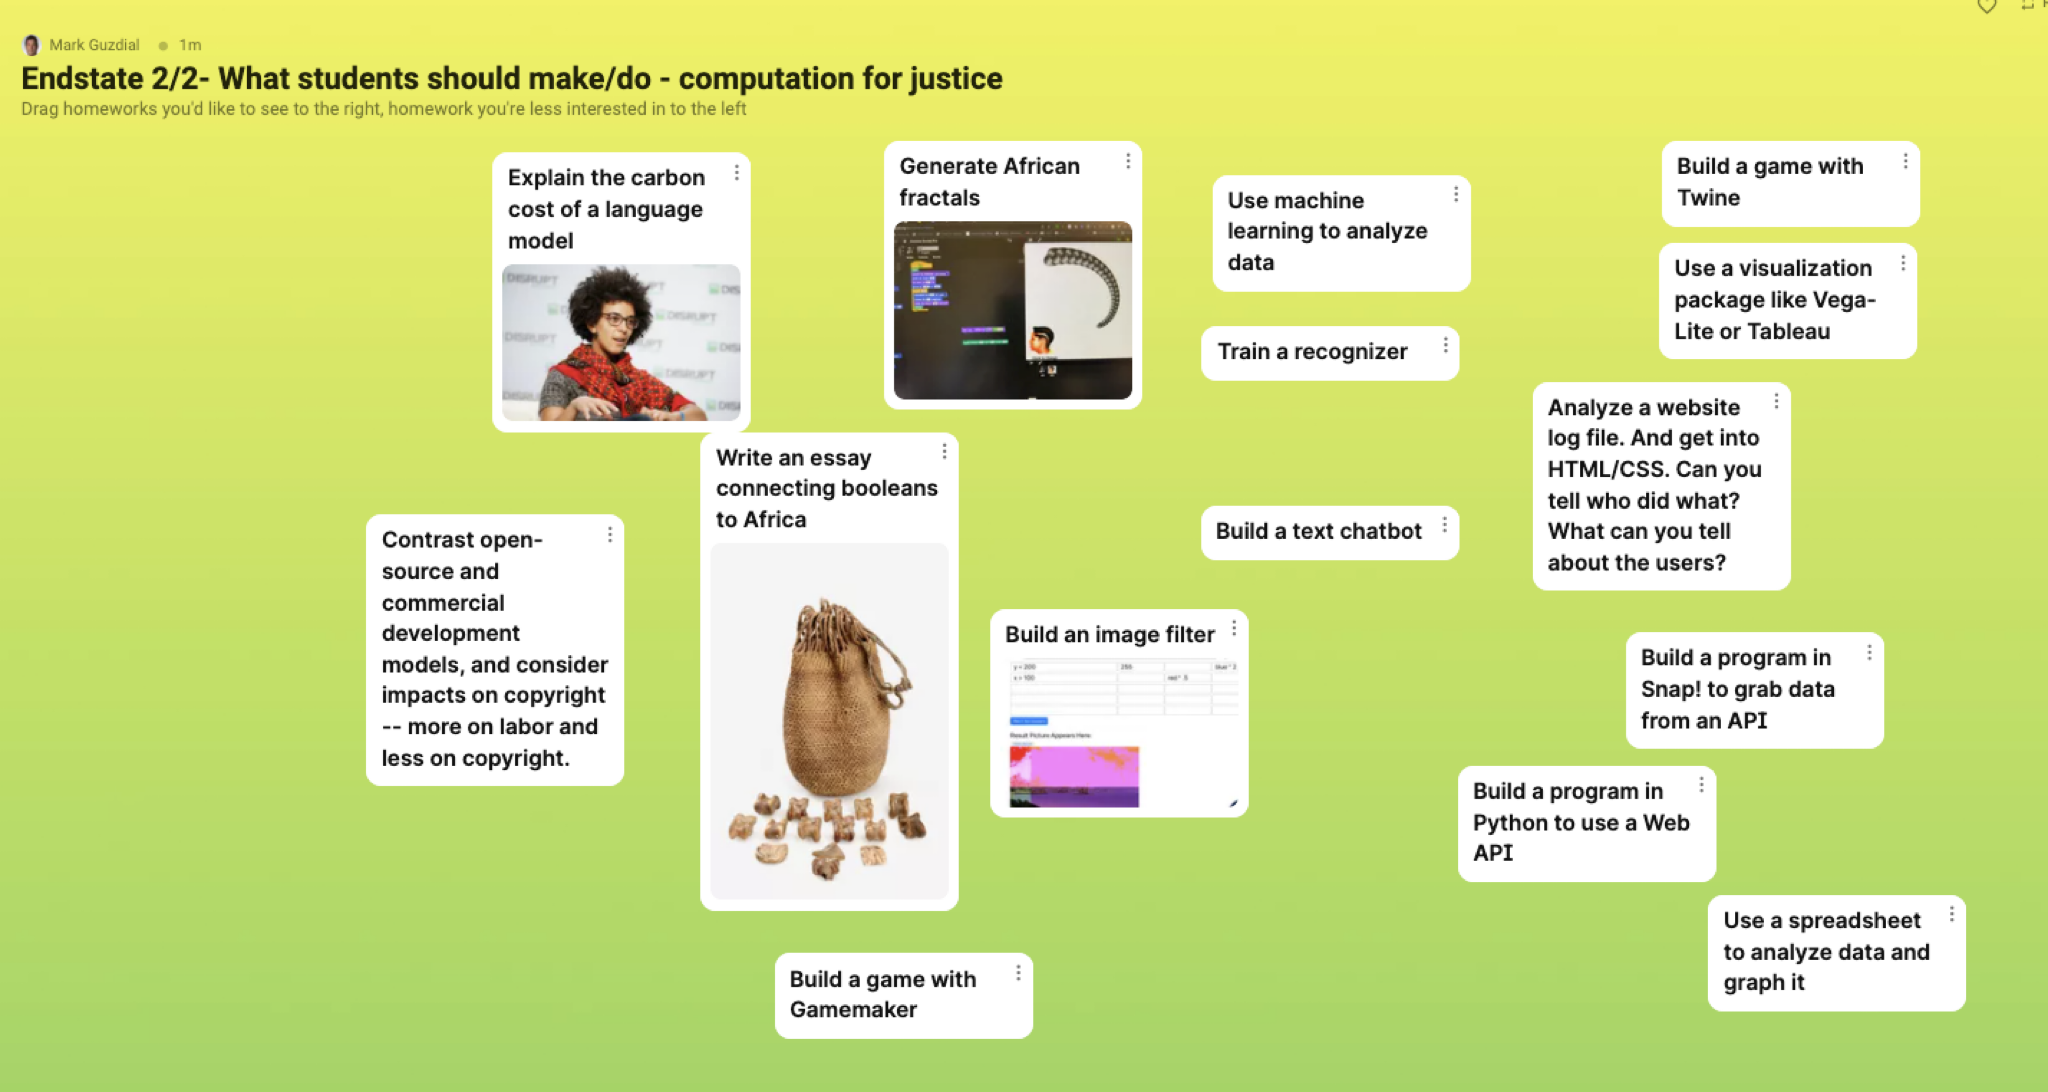
Justice – Learning Activities
These are Standards
The best description of how I used these whiteboards and the discussion notes is that these are my standards. My advisors said very clearly during the sessions — there are too many learning objectives and activities for one course here. Things on the left are not unimportant. They’re just not as important.. I can’t possibly get to everything on these whiteboards in a single semester class designed for arts and humanities students (as the primary audience) with no programming background and with some hesitancy about mathematics.
My advisors were designing in a vacuum. They weren’t going to actually teach this course. Most of them had never seen a course that tried to achieve these objectives for this student audience. So they told me (for Justice), “Yeah, use Jupyter notebooks, and teach HTML and databases and code, all in one semester. And don’t make students install anything on their computers — do it all in the browser.” But they didn’t really have an idea how this might work, or if it was possible. They also didn’t articulate, “You’ll probably to teach about data and iteration and conditionals in here, too.”
It was my job to use these standards as priorities, cover what I could, and fill in with the computer science knowledge to make these do-able. We are also using these to inform future classes, the next classes we make for PCAS. You can compare these whiteboards back up to the course pages at the top of this post to decide how well we did.
Overall, we use participatory design methods a lot as we design for PCAS, to get the input of faculty outside of CS, because these aren’t computer science classes. They are not CS0, CS1, or CS0.5, all of which presume a linear progression towards the goal of being a CS major. Yes, we’re teaching computer science knowledge and skills, but these are classes in Computing for Expression and Computing for Justice. The faculty in those areas are the authorities in what we should teach. They decide what’s important.
Side note: I’ve had these data for over a year, and even presented some of them in a poster at ITiCSE last year. I have trying to figure out how to share them. Maybe this could have been a peer-reviewed publication (conference or journal)? I don’t know. It’s a design activity, and I learned a lot from it, but I don’t know how to write about it as scholarship. I finally decided to write this blog post so that I could share the whole big Padlet whiteboards. Traditional publication venues would be unlikely to let me put these big pictures out there, but I can in a blog post.
My many thanks to my advisors for these classes: Yvette Granata, Catherine Griffiths, M. Remi Yergeau, Tony Bushner, Justin Schell, Jan Van den Bulck, Justin Joque, Sarita Schoenebeck , Nick Henricksen, Maggie Frye, Anne Cong-Huyen, and Matt Bui
From Guided Exploration to Possible Adoption: Patterns of Pre-Service Social Studies Teacher Engagement with Programming and Non-Programming Based Learning Technology Tools
In October, Bahare Naimipour presented our paper ”From Guided Exploration to Possible Adoption: Patterns of Pre-Service Social Studies Teacher Engagement with Programming and Non-Programming Based Learning Technology Tools” (Naimipour, Guzdial, Shreiner, and Spencer, 2021) at the Society for Information Technology and Teacher Education (SITE) 2021 conference. (Draft of the paper is available here. Full paywall version available here.) This paper is the first one about our work with social studies teachers since we received NSF funding. It was also a report on our last face-to-face participatory design session (in March 2020) before the pandemic lockdown. And most importantly, it was our first session with our data visualization tool DV4L in the mix.

I have blogged about our participatory design sessions before (see Bahare’s FIE paper from last Fall). Basically, we set up a group of social studies teachers in pairs, then ask them to try out various visualization tools with activity sheets that we have created to scaffold their process. The goal is to get everyone to make a visualization successfully in less than 10 minutes, and leave time to explore or try one (or both) other tools. There is time for the pairs to persuade each other to (a) come try the cool tool they found or (b) avoid this tool because it’s too hard or not useful. The tools in this set were Vega-Lite (a declarative programming tool which our teachers have found complex but useful in the past), CODAP (a drag-and-drop visualization tool designed for middle and high school students), and our DV4L (a purpose-built visualization tool that makes code visible but not required).
The teachers saw value in having students build visualization themselves (e.g., “I think making your own data visualization allows for a deeper connection and understanding of the data.”) As we hoped, they teased out what they liked and disliked about the tools. Most of the teachers preferred DV4L over the other two tools, because of its simplicity. Critically, they felt that they were engaging with the inquiry and not the tool: “(With DV4L) I found myself asking questions connected to the data itself, rather than asking questions in order to figure out how to work the visual.”
That teachers found DV4L easier than Vega-Lite isn’t really surprising. We were pleased that teachers weren’t disappointed with DV4L’s more limited visualization capabilities. What was really surprising was that our teachers preferred DV4L to CODAP, and this has happened in successive in-service teacher participatory design sessions during the pandemic. CODAP is drag-and-drop, creates high-quality visualizations, and was designed explicitly for middle and high school students. A teacher in one of our in-service design sessions explained to me why she preferred DV4L to CODAP. “CODAP is really powerful, but it would take me at least three hours to get my students comfortable with it. Is it worth it?” Just how much visualization is any social studies teacher going to use? Again, too much focus on the tool gets in the way of the social studies inquiry.
Now you might be asking, “But Mark, do the students learn history with DV4L? And do they see and learn about computing?” Great questions — we’re not there yet. Here’s one of our big questions, after running several more participatory design sessions with teachers since the lockdown: Why aren’t teachers adopting DV4L in their classrooms? They tell us that they really like it. But nobody’s adopted yet. How do we go from “ooh, great tool!” to “and here’s my lesson plan, and we’ll use it next week”? That’s an active area of research for all of us right now.
Social Studies Teachers using Programming for Data Visualization: An FIE 2020 Paper Preview
The Frontiers in Education (FIE) 2020 conference starts Wednesday October 21 in Uppsala, Sweden — see program here. My student Bahare Naimipour will be presenting our paper “Engaging Pre-Service Teachers in Front-End Design: Developing Technology for a Social Studies Classroom” (see preprint here) by Bahare, me, and Tammy Shreiner. This work came long before the NSF work that we just got funded for (see blog post here), but it’s in the same line of research.
The paper is about two of our participatory design sessions with pre-service social studies teachers in Tammy’s class on data literacy. In both of these sessions, we asked teachers to program in JavaScript or Vega-Lite to build a visualization, and in the second one, we also introduce CODAP, a visualization tool explicitly designed for middle and high school students. The paper is less about the technology and more about what the teachers told us about what they thought about tools for visualization in their class.
Social studies teachers are such an interesting group to study. They’re not particularly interested in STEM, data, or computers. They want to teach social studies. Very few of our participants had ever seen any code. (One told us, “This looks a lot like setting up my MySpace page in middle school!”)They’re only interested if we can help them teach what they want to teach. It’s a hard audience to engage, in all the right ways.
I’m going to highlight just two lessons we learned here:
First: The results from the two participatory design sessions were remarkably different. Participatory design isn’t a “okay, we did that — check off the box” methodology. Each group of participants can be remarkably different. There’s no generalization here. Each session is useful, but I don’t know how many sessions we’d have to do to get anywhere near saturation. That’s okay — we learned design lessons from each session.
Second: There is no one answer to how teachers think about programming. I have heard from many people that teachers find programming hard (see this CACM Blog post about that discussion), and I’ve hypothesized that to be true in this blog (see this post). So, now I’ve been in the room as social studies teachers have their first programming experiences and interviewing them afterwards, and….it’s complicated.
Teachers tell us often in our sessions that programming is overwhelming, but several teachers also told us that CODAP (explicitly designed for their use, and not a programming tool) was overwhelming. The question is whether it’s worth the complexity — and for whom. We get contradictory responses from the teachers, which we report in this paper. One told us that she wanted a simpler tool for herself and JavaScript for her students: “I don’t mind keeping life simple for me, but I wanted to challenge my students and give them useful, new skills.” Another teacher told us the opposite: “I would like Java[script] because it would let me do more to the visualization. Vega-lite would be better for students because it seems far more simple.”
We couldn’t fit in all the great stories and insights from these two participatory design sessions. Like the teacher who wants JavaScript in her class because, “That’s similar to what they use in math and science, right? I don’t want history to be the ‘dumbed-down’ programming.” I found that surprising, and wondered what the teachers would think of a block-based language. Another teacher told us that she wants to use programming in her history class, “Because maybe that would make history ‘cool.’” One of the tensions I found most interesting in these sessions was between the desire to know the tools and be comfortable in front of the class, and the desire to push their students to learn more. Some teachers told us that they preferred CODAP to any programming tool because they would be embarrassed to get a syntax error in front of their kids, which they realized would always be possible when programming. Other teachers told us that they were more concerned with going beyond basic tools — (paraphrasing one comment we received), “My students will already know Excel and Google Sheets. I want them to do more in my class.”
Our work is ramping up now. We had another PD session with pre-service teachers in March, just before pandemic lockdown, which was our first one with our data visualization tool in the mix. We’ve just held our first workshop in August for in-service (practicing) teachers. We’ve got more workshops planned over the next year. You’ll likely be hearing more from these studies in future posts.
Iterative and interdisciplinary participatory design sessions: Seeking advice on a research method
Here’s an unusual post for this blog: I’m looking for a research methodology, and I don’t know where to look for it. I’m hoping somebody here will have a suggestion — please do forward this blog post to others you think might have suggestions for me.
We’re running participatory design sessions with teachers — asking teachers to try out programming languages with scaffolded activities, and then tell us about what they’d like for their classroom. I’m collaborating with Tammy Shreiner and Bradford Dykes at Grand Valley State University around having social studies teachers build data visualizations. We’re scouring the book Participatory Design for Learning, and in particular, we’re using Michelle Wilkerson’s chapter (which I’ve read twice now) because it matches the kind of work we’re doing.
Michelle uses a technique called Conjecture Mapping to describe how her teams thinks about the components of a participatory design session. A session has a specific embodiment (things you put into the classroom or session), which you hope will lead to mediating processes (e.g., participants exploring data, people talking about their code, etc.). These are processes which should lead to desired outcomes based on theory. A conjecture map is like a logic model in that it connects your design to what you want to have happen, but a conjecture map is less about measuring outcomes. Rather, it’s more about describing mediating processes, which you theorize will lead to desired outcomes. The mediating process column is really key — it tells you what to look for when you run the design session. If you don’t hear the kind of talk you want and see participant success in the activity, something has gone wrong. Fix it before the next iteration. The paper on this technique is Conjecture Mapping: An Approach to Systematic Educational Design Research by William Sandoval.
So here’s the first problem: We have different set of outcomes for our sessions. They’re interdisciplinary. I want to see the teachers being successful with their programs, my collaborators Tammy Shreiner and Bradford Dyke wants to see them talking about their data, and we all want to see participants relating their data visualizations to their history class (e.g., they shouldn’t be just making pretty pictures, and they should be connecting the visual elements to the historical meaning). Should we put all of these mediating processes and outcomes into one big conjecture map?
We are not satisfied with this combined approach, because we’re going to be iterating on our designs over time. Most participatory design approaches are iterative, but I haven’t seen a way of tracking changes (in embodiment or mediating practices) over time. Right now, we’re working with Vega-Lite and JavaScript. In our next iterations, we’ll likely do different examples with Vega-Lite. Over time, we want to be building prototypes of data visualization languages designed explicitly for social studies educators (task-specific programming languages).
We are concerned about two big problems as we iterate:
- Missing Out. I don’t want to lose any of our mediating processes. I want to make sure that we continue to see success with programming, engagement with data, and meaningful visualizations.
- Changing the balance. The easiest trap for our work will be to over-emphasize the programming, and swamp out the data literacy and data visualization processes and outcomes. If our sessions become perceived as primarily a programming activity, we’re moving in the wrong direction. We want the data literacy and data visualization to be primary, with programming as a supporting activity.
The diagram at the bottom may help describe the problem — it’s the sketch that my PhD student Bahare Naimipour and I made while talking through this problem. We need to track multiple disciplinary processes and outcomes over time as we iterate across different embodiments. This isn’t about assessing an intervention or design. This is about gathering input as we design and implement technology prototypes. We want to be moving in the right direction, for the processes and outcomes that we want.
Here’s where I’m asking for help: Where should we be looking for exemplars? Who else is doing iterative, multidisciplinary participatory design sessions? What are good methods for use to use?
Thanks!


Recent Comments