AP CS 2014 Results: Big jumps in participation! Demographics still poor
March 4, 2015 at 8:46 am 3 comments
Every year, Barbara Ericson does an analysis of the AP CS exam demographics by state. The 2013 analysis (see here) got a lot of media attention (see on-going list). Here’s the run-down for 2014. Her detailed national analysis (from which I quote in this document) can be found here, and her detailed race and gender analysis (which I include some) can be found here.
Nationally, 37,327 students took the AP CS A exam in 2014. This was a big increase (26.29%) from the 29,555 students who took it in 2013.
- The number of schools who passed the audit (which is a reasonable proxy for the number of AP CS teachers) went up by almost 300: 2,525 versus 2,252 the previous year.
- The number of female exam-takers was 7,458 (20%) which was up from 5,485 the year before (18.5%).
- The number of black students was 1,469 which was an increase from 1,090 the previous year. The number of Hispanic students was 3,270 up from 2,408 the previous year.
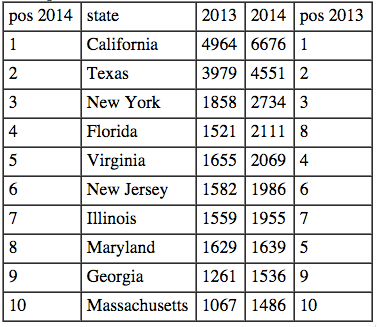
The top 10 states in terms of the number of exams taken were in 2014 were (with their 2014 and 2013 positions listed — Florida rose and Maryland dropped):
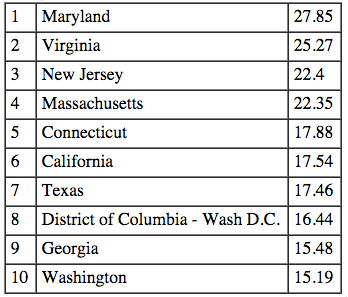
But California is also the largest state. If we control for population, here are the top 10 states by # exams in 2014 / estimated 2012 population / 100,000:
Eight states had a decrease in the number of students taking the AP CS A exam from the previous year: Oregon, Oklahoma, South Dakota, Kansas, Montana, Arkansas, West Virginia, and Maine.
Eighteen states had less than 100 people take the AP CS A exam in 2014, with Wyoming still the only state with no students taking the exam.
Barbara had help from Phil Sands from Purdue this year in doing the demographic analysis.
Females: The top three states with the most women taking the exam in 2014 are:
- California with 1599 exams (24%) and a pass rate of 65%
- Texas with 1102 exams (24%) and a pass rate of 51%
- New York with 504 exams (18.4%) and a pass rate of 56%
The top three states with the highest percentage of females taking the exam are (number of women / number of exams)
Mississippi (1/4 = 25%), Washington (260/1048 = 25%), Oklahoma (42/171 = 25%).
Tennessee, which had 31% female exam-takers in 2012, is no longer in the top ten of states.
No females took the exam in Montana (0 women of 4 exam takers) or Wyoming (but nobody took the exam in Wyoming). Eight more states had at least one woman but less than 10 women take the exam:Mississippi (1/4), North Dakota (1/14), Nebraska (2/71), Kansas (3/40), Alaska (4/30), South Dakota (4/29) and Utah (5/104) and Delaware (7/79).
African American: The top three states that had the most African American students take the exam in 2014 are:
- Maryland with 192 exams and a pass rate of 30.2% for African Americans compared to the overall pass rate of 62.1%.
- Texas with 161 exams and a pass rate of 40% compared to the overall pass rate of 55.7%.
- Georgia with 155 exams and a pass rate of 23% compared to the overall pass rate of 45.8%.
Thirteen states had no African American exam-takers in 2014 (number of African Americans / number of exams)
Alaska (0/30), Idaho (0/58), Kansas (0/40), Maine (0/99), Mississippi (0/4), Montana (0/4), Nebraska (0/71), New Hampshire (0/108), New Mexico (0/61), North Dakota (0/14), South Dakota (0/29), Vermont (0/71), and Wyoming (0/0).
Hispanic: The top three states that had the most Hispanics take the exam in 2014 (the College Board separates this into Mexican American, Puerto Rican, and Other Hispanic)
- Texas with 968 and a pass rate of 32% compared to the overall pass rate of 55.7%.
- California with 610 and a pass rate of 45.2% compared to the overall pass rate of 67.3%.
- Florida with 450 and a pass rate of 39.1% compared to the overall pass rate of 42.5%.
Seven states had no Hispanics take the exam in 2014: Iowa (0/119) which is 5.5% Hispanic by population, Mississippi (0/4) which is 2.9% Hispanic, Montana (0/4), North Dakota (0/14), South Dakota (0/29), West Virginia (0/48), and Wyoming (0/0).
Entry filed under: Uncategorized. Tags: APCS, BPC, computing education research, NCWIT, women in computing.
3 Comments Add your own
Leave a comment
Trackback this post | Subscribe to the comments via RSS Feed


1. Ralph Case | March 6, 2015 at 9:34 am
There’s an error in the “top 10 States / Population” table – in the source you quoted. This table only shows the top 9.
2. Top Ed-Tech Trends of 2015: Standardized Testing | Co-Opt-Ed | December 6, 2015 at 8:43 am
[…] but I will note here: “Nationally, 37,327 students took the AP CS A exam in 2014,” Mark Guzdial observed. “This was a big increase (26.29%) from the 29,555 students who took it in 2013.” […]
3. AP Computer Science Demographics Report for 2015 completed #CSEdWeek | Computing Education Blog | December 11, 2015 at 7:11 am
[…] post, but I will note here: “Nationally, 37,327 students took the AP CS A exam in 2014,” Mark Guzdial observed. “This was a big increase (26.29%) from the 29,555 students who took it in 2013.” “Barbara […]