Posts tagged ‘data science’
Helping social studies teachers to teach data literacy with Teaspoon languages
Last year, Tammy Shreiner and I received NSF funding to develop and evaluate computational supports for helping social studies teachers to teach data literacy and computing(see post here). We’re excited about what we’re doing and what we’re learning. Here’s an update on where we’re at on the project.
Teaspoon Languages
We have a chapter in the new book by Aman Yadav and Ulf Dalvad Berthelsen Computational Thinking in Education: A Pedagogical Perspective. This is the publication where we introduce the idea of Teaspoon Languages. Teaspoon languages are a form of task-specific languages (TSP => Teaspoon — see?). Teaspoon languages:
- Support learning tasks that teachers (typically non-CS teachers) want students to achieve;
- Are programming languages, in that they specify computational processes for a computational agent to execute; and
- Are learnable in less than 10 minutes, so that they can be learned and used in a one hour lesson. If the language is never used again, it wasn’t a significant learning cost and still provided the benefit of a computational lesson.
We say that we’re adding a teaspoon of computing to other subjects. The goal is to address the goal of “CS for All” by integrating computing into other subjects, by placing the non-CS subjects first. We believe that programming can be useful in learning other subjects. Our primary goal is to meet learning objectives outside of CS using programming. Teachers (and students eventually) will be learning foundational CS content — but not necessarily the content we typically teach in CS classes. All students should learn that a program is non-WYSIWYG, that it’s a specification of a computational process that gets interpreted by a computational agent, that programming languages can be in many forms, and that all students can be successful at programming.
Our chapter, “Integrating Computing through Task-Specific Programming for Disciplinary Relevance: Considerations and Examples” (see link here) offers two use cases of how we imagine teaspoon languages to work in classrooms (history and language arts in these examples). The first use case is around DV4L, our Data Visualization for Learning tool. The second is around a chatbot language that we developed —- and have long since discarded.
We develop our teaspoon languages in a participatory design process, where teachers try our prototypes in authentic tasks as design probes, and then they tell us what we got wrong and what they really want. Our current iteration is called Charla-bots and is notable for having user-definable languages. We have a variety of Charla-bot languages now, with English, Spanish, and mixed keywords.
Our vision for teaspoon languages is a contrast with the “Hour of Code” approach. The “Hour of Code” is a one hour programming activity that many schools use in every grade, typically once a year during CS Ed Week (in early December). The great idea is to build familiarity and confidence in programming by showing students real computer science every year. The teaspoon languages approach is to imagine one or two little learning programming activity in every social studies, language arts, and mathematics class every year. Each of these languages is tiny and different. The goal is that by the time that US students take a CS class (typically, in high school or undergraduate), they will have had many programming experiences, have seen a variety of types of programming languages, and have a sense that “programming isn’t hard.”
Meeting the Needs of Social Studies Teachers
The second paper, “Using Participatory Design Research to Support the Teaching and Learning of Data Literacy in Social Studies” (see link here) was just presented in October by Tammy at CUFA, the College and University Faculty Assembly 2021 of the National Council of the Social Studies. (We have a longer form of this paper that we have just submitted to a journal.) This is an exciting paper for me because it’s exactly addressing the critical challenge in our work. We can design and implement all kinds of prototype Teaspoon languages, but to achieve our goals, teachers in disciplines other than CS have to see value and adopt them.
The paper is about our workshops with practicing social studies teachers. Tammy has a goal to teach social studies teachers how to teach data literacy. She has built a large online education resource (OER) on teaching data literacy in social studies. Learning data literacy involves being able to read, comprehend, and argue with data visualizations, but also being able to create them. That’s where we come in. Her OER links to several tools for creating data visualizations, like Timeline JS, CODAP, and GapMinder. Most of them were not created for social studies teachers or classes. When we run these workshops, our tools are just in-the-mix. We offer scaffolding for using all of them. These are our design probes. The teachers use the tools and then tell us what they really want. These are our data, and we analyze them in detail —- as in this paper.
Let’s jump to the bottom line: We’re not there yet. The teachers love the OER, but get confused about why should do in their classes. They find the tools for data visualization fascinating, but overwhelming. They like DV4L a lot:
One pre-service teacher explained that they preferred our prototype over other tools because “(with the prototype DV4L) I found myself asking questions connected to the data itself, rather than asking questions in order to figure out how to work the visual.”
Recently, I held a focus group with some social studies teachers who told me that they won’t use any computational tools —- they believe in teaching data visualization, but all created with pencil and ruler. That’s our challenge: Can we be more powerful, more enticing, and easy enough to beat out pencil and ruler? Our tool, DV4L, is purpose-built for these teachers, and they appreciate its advantages — and yet, few are adopting. That’s where we need to work next.
Opportunities for Social Studies Teachers to Get Involved
If you know a social studies teacher who would want to keep informed about our work and perhaps participate in our workshops or studies, please have them sign up on our mailing list. Thank you!
Often, what teachers tell us they really want suggests new features or entirely new tools. We have two ongoing studies where we are looking for design feedback from social studies teachers. If you know social studies teachers who would like to play with something new (and we’ll pay them for their time), would you please forward these to them?
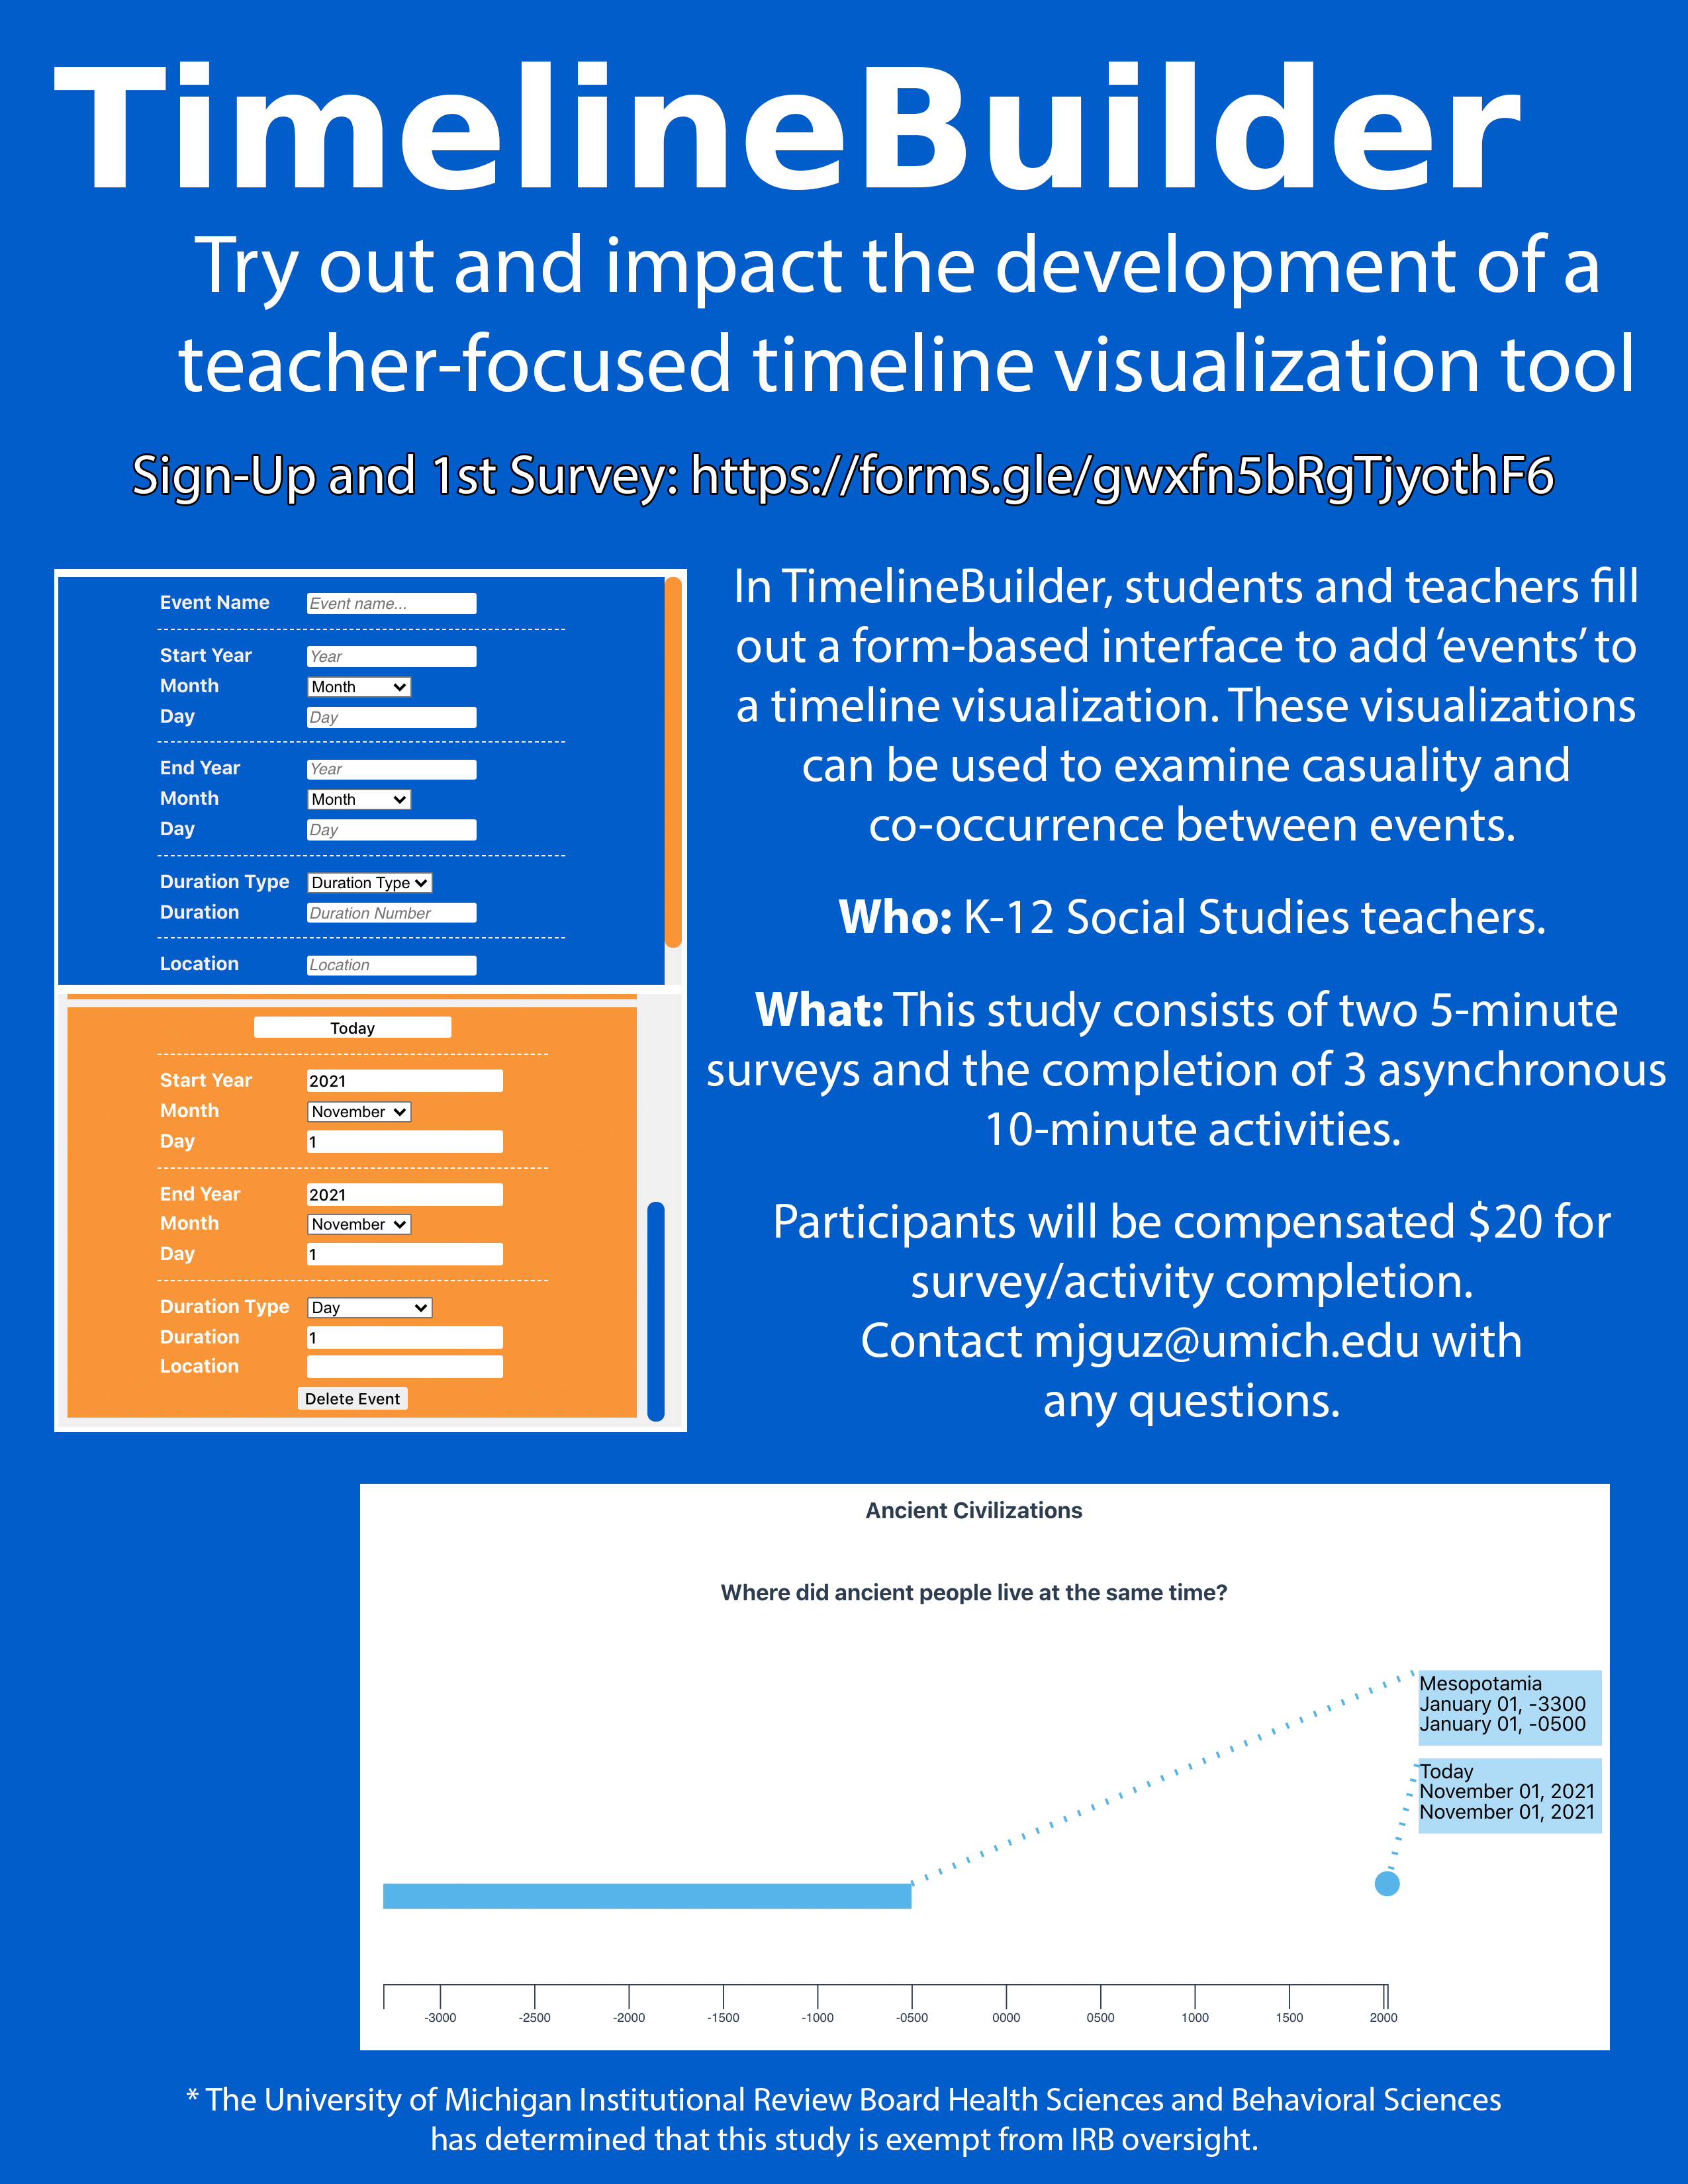
Timeline Builder
We’re looking for K-12 Social Studies teachers to try out our new timeline visualization tool, TimelineBuilder. TimelineBuilder has been made with teachers and usability in mind. In it, ‘events’ are added to a timeline using a form-based interface. Changes to the timeline can be seen automatically, with events showing up as soon as they are added.
This study will consist of completing 2 surveys and 3 asynchronous activities guided by worksheets. All participants will be compensated with a $20 gift card for survey and activity completion. There is an additional option to be invited to a focus group, which will provide additional compensation.
If you are interested in participating in this study, you can complete the consent form and 1st survey here. (Plain text Link: https://forms.gle/gwxfn5bRgTjyothF6 )
Please contact Mark Guzdial (mjguz@umich.edu) or Tamara Nelson-Fromm (tamaranf@umich.edu) with any questions.
The University of Michigan Institutional Review Board Health Sciences and Behavioral Sciences has determined that this study is exempt from IRB oversight.
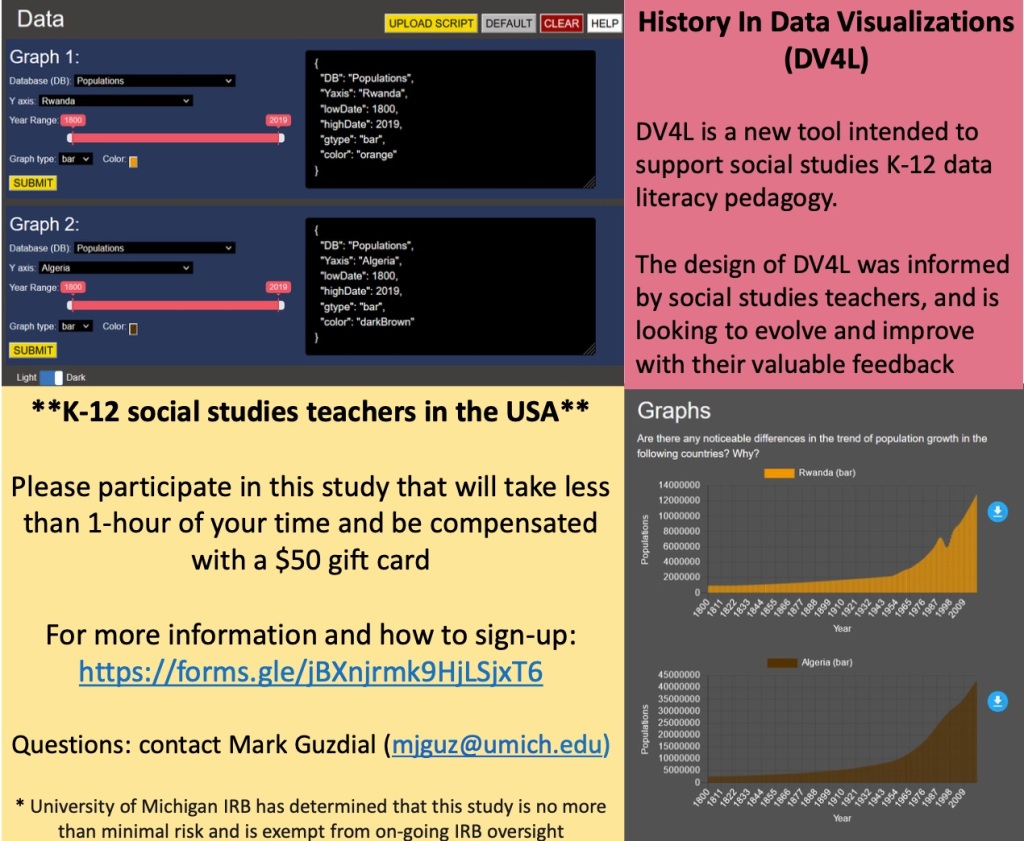
DV4L Scripting Study
Through our work with social studies educators thus far, we have designed the tools DV4L-Basic and DV4L-Scripting specifically to support data literacy standards in social studies classrooms. If you are a social studies middle or high school teacher, we would love to hear your feedback. If you can spare less than an hour of your time to participate in our study, we will send you a $50 gift card for your time and valuable feedback.
If you are interested but want more details, please visit/complete the consent form here: https://forms.gle/yo3yWGThQ1wnhu7g7
For questions or concerns, please contact Mark Guzdial (mjguz@umich.edu) or Bahare Naimipour (baharen@umich.edu).
References
Guzdial, M. and Tamara L. Shreiner. 2021. “Integrating Computing through Task-Specific Programming for Disciplinary Relevance: Considerations and Examples.” In Computational Thinking in Education: A Pedagogical Perspective, Aman Yadav and Ulf Dalvad Berthelsen (Eds). PDF of Submitted.
Shreiner, Tamara L., Mark Guzdial, and Bahare Naimipour. 2021. “Using Participatory Design Research to Support the Teaching and Learning of Data Literacy in Social Studies.” Presented at CUFA, the College and University Faculty Assembly 2021 of the National Council of the Social Studies. PDF
Let’s program in social studies classes: NSF funding for our work in task-specific programming languages
If we want all students to learn computer science (CS for All), we have to go to where the students are. Unfortunately, that’s not computer science class. In most US states, less than 5% of high school students take a course in computer science.
Programming is applicable and useful in many domains today, so one answer is to use programming in science, mathematics, social studies, and other non-CS classes. We take programming to where the students are, and hope to increase their interest and knowledge about CS. I love that idea and have been working towards that goal for the last four years. But it’s a hard sell. I told the story in 2018 (see post here) about how the mathematics teachers rejected our pre-calculus course that integrated computing. How do we help non-CS teachers to see value in computing integrated into their classes?
That’s the question Tammy Shreiner at Grand Valley State and I get three years to explore, thanks to a new grant from the US National Science Foundation in the research strand of the “CS for All” Program. Tammy teaches a course on “Data Literacy for Social Studies Teachers” at GVSU, and she (with her colleague Bradford Dykes) have been building an open educational resource (OER) to support data literacy education in social studies classes. We have been working with her to build usable and useful data visualization tools for her curriculum. Through the grant, we’re going to follow her students for three years: From taking her pre-service class, out into their field experiences, and then into their first classes. At each stage, we’re going to offer mentoring and workshops to encourage teachers to use the things we’ve showed them. In addition, we’ll work on assessments to see if students are really developing skills and positive attitudes about data literacy and programming.
Just a quick glimpse into the possibilities here. AP CS Principles exam-takers are now about 25% female. AP US History is 56% female exam takers. There are fives times as many Black AP US History exam-takers as AP CSP exam-takers. It’s a factor of 14 for Hispanic students. Everyone takes history. Programming activities in a history class reach a far more diverse audience.
I have learned so much in the last couple of years about what prevents teachers from adopting curriculum and technology — it’s way more complicated than just including it in their pre-service classes. Context swamps pre-service teaching. The school the teacher goes to influences what they adopt more than what they learned pre-service. I’ve known Anne Ottenbreit-Leftwich for years for her work in growing CS education in Indiana, but just didn’t realize that she is an expert on technology adoption by teachers — I draw on her papers often now.
Here’s one early thread of this story. Bahare Naimipour, an EER PhD student working with me, is publishing a paper at FIE next month about our early participatory design sessions with pre-service social studies teachers. The two tools that teachers found most interesting were CODAP and Vega-Lite. Vega-Lite is interesting here because it really is programming, but it’s a declarative language with a JSON syntax. The teachers told us that it was powerful, flexible — and “overwhelming.” How could we create a scaffolded path into Vega-Lite?
We’ve been developing a data visualization tool explicitly designed for history inquiry (you may remember seeing it back here). We always show at least two visualizations, because historical problems start from two accounts or two pieces of data that conflict.

As you save graphs in your inquiry to the right, you’re likely going to lose track of what’s what. Click on one of them.

This is a little declarative script, in a Vega-lite-inspired JSON syntax. It’s in a task-specific programming language, but this isn’t a program you write. This is a program the describes the visualization — code as a concise way of describing process.
We now have a second version where you can edit the code, or use the pull-down menus. These are linked representations. Changing the menu changes the code and updates the graph. Changing the code updates the menu and the graph. Now the code is also malleable. Is this enough to draw students and teachers into programming? Does it make Vega-Lite less overwhelming? Does it lead to greater awareness of what programming is, and greater self-efficacy about programming tasks?

We just had our first in-service teacher workshop with these tools in August. One teacher just gushed over them. “These are so great! How did I not know that they existed before?” That’s easy — they didn’t exist six months ago! We’re building things and putting them in front of teachers for feedback as quickly as we can, in a participatory design process. We make lots of mistakes, and we’re trying to document those, too. We’re about applying an HCI process to programming experience design — UX for PX.
If you know a social studies teacher who would want to keep informed about our work and perhaps participate in our workshops, please have them sign up on our mailing list. Thank you!
Data science as a path to integrate computing into K-12 schools and achieve CS for All
My colleague Betsy DiSalvo is part of the team that just released Beats Empire, an educational game for assessing what students understand about middle school computer science and data science https://info.beatsempire.org The game was designed by researchers from Teachers College, Columbia University; Georgia Tech; University of Wisconsin, Madison; SRI International; Digital Promise; and Filament Games in concert with the NYC Dept. of Education. Beats Empire is totally free; it has already won game design awards, and it is currently in use by thousands of students. Jeremy Roschelle was a consultant on the game and he just wrote a CACM Blog post about the reasoning behind the game (see link here).
Beats Empire is an example of an important development in the effort to help more students get the opportunity to participate in computing education. Few students are taking CS classes, even when they’re offered — less than 5% in every state for whom I’ve seen data (see blog post here). If we want students to see and use computing, we’ll need to put them in other classes. Data science fits in well with other classes, especially social studies classes. Bootstrap: Data Science (see link here) is another example of a computing-rich data science curriculum that could fit into a social studies class.
Social studies is where we can reach the more diverse student populations who are not in our CS classes. I’ve written here about my work developing data visualization tools for history classes. For a recent NSF proposal, I looked up the exam participation in the two Advanced Placement exams in computer science (CS Principles and CS A) vs the two AP exams in history (US history and World history). AP CS Principles was 32% female, and AP CS A was 24% female in 2019. In contrast, AP US History was 55% female and AP World History was 56% female. Five times as many Black students took the AP US History exam as took the AP CS Principles exam. Fourteen times as many Hispanic students took the AP US History exam as took the AP CS Principles exam.
Data science may be key to providing CS for All in schools.
International effort to improve data science in schools
I’ve been involved in this project over the last few months. (Where “involved” means, “a couple of phone conversations, and a set of emails about frameworks, standards, and curricula, and I missed every physical meeting.”) Nick Fisher has drawn together an impressive range of experts and professional societies to back the effort. It’s not clear where it’s going, but it is indicative of a growing worldwide interest in “data science” in schools.
The definition of “data science” is fuzzy for me, almost as fuzzy as the term “computational thinking.” Does data science include computer science? statistics? probability? I think the answer is “yes” to all of those, but then it might be too big to easily teach in secondary schools. If we’re struggling to teach CS to teachers, how do we teach them CS and statistics and probability?
And if budgets and schedules are are a zero-sum game, what do we give up in order to teach data science? For example, teacher preparation programs are packed full. What do we not teach in order to teach teachers about data science?
This group of experts knows a lot about what works in data science. Their opinion on what students need to know creates a useful measuring stick with which to look at the several data science classes that are being created (such as Unit 5 in Exploring CS). There’s some talk about this group of experts might develop their own course. I’m not sure that it’s possible to create a course to work internationally — school systems and expectations vary dramatically. But a framework is useful.
The aim of the International Data Science in Schools Project (IDSSP) is to transform the way data science is taught the last two years of secondary school. Its objectives are:
1. To ensure that school children develop a sufficient understanding and appreciation of how data can be acquired and used to make decisions so that they can make informed judgments in their daily lives, as children and then as adults
2. To inspire mathematically able school students to pursue tertiary studies in data science and its related fields, with a view to a career.
“In both cases, we want to teach people how to learn from data,” Dr Fisher said.
Two curriculum frameworks are being created to support development of a pre-calculus course in data science that is rigorous, engaging and accessible to all students, and a joy to teach.
- Framework 1 (Data Science for students). This framework is designed as the basis for developing a course with a total of some 240 hours of instruction.
- Framework 2 (Data Science for teachers). As a parallel development, this framework is designed as the basis for guiding the development of teachers from a wide variety of backgrounds (mathematics, computer science, science, economics, …) to teach a data science course well.
Dr Fisher said that the draft frameworks will be published for widespread public consultation in early 2019 before completion by August.
“We envisage the material will be used not just in schools, but also as a valuable source of information for data science courses in community colleges and universities and for private study.” For further information: idssp.info@gmail.com, or visit www.idssp.org

Recent Comments